Quantifying the value of IDBs in infographics
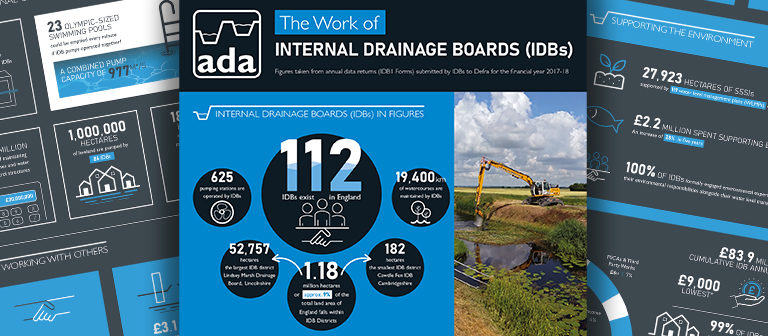
ADAs Technical and Environment Committee instigated a workstream in 2018 to establish a methodology to collect, collate and interpret data from IDBs, which can be used to better explain their value and purpose to decision makers and the wider public. ADA is pleased to launch a key output from this project; IDB infographics, which are based on the IDB1 data submitted to Defra by each IDB each year as part of their annual returns. This first publication is based on the 2017-2018 submissions but can and will be updated to present the most recent data each year.
These infographics hopefully need little explaining as they have been carefully designed to present key facts, figures and trends related to IDBs in a visual and concise way. Individual data which provide an overview of a particular aspect of an IDBs work have been grouped together in modules which can each be delivered separately or with any number of other modules in order to support the message being communicated. This means that the infographics are suitable for a wide range of audiences and purposes.
ADA encourages all IDB’s and industry stakeholders to use the infographics to support their communications and promote and publicise their work both locally and on a national level. ADA will of course do the same. The infographics can be downloaded from here.
This project could not have reached this successful conclusion if it were not for the support of many IDB colleagues and our thanks go to all involved for their input.
Categories
Archive
- May 2026
- April 2026
- February 2026
- January 2026
- December 2025
- November 2025
- October 2025
- July 2025
- June 2025
- March 2025
- February 2025
- January 2025
- December 2024
- November 2024
- October 2024
- September 2024
- August 2024
- July 2024
- June 2024
- May 2024
- April 2024
- March 2024
- January 2024
- December 2023
- November 2023
- October 2023
- September 2023
- August 2023
- July 2023
- June 2023
- May 2023
- April 2023
- March 2023
- February 2023
- January 2023
- December 2022
- September 2022
- August 2022
- July 2022
- June 2022
- May 2022
- April 2022
- March 2022
- February 2022
- January 2022
- December 2021
- November 2021
- September 2021
- July 2021
- May 2021
- March 2021
- February 2021
- January 2021
- December 2020
- November 2020
- October 2020
- September 2020
- August 2020
- July 2020
- May 2020
- April 2020
- March 2020
- February 2020
- January 2020
- December 2019
- November 2019
- October 2019
- September 2019
- August 2019
- July 2019
- June 2019
- May 2019
- April 2019
- March 2019
- February 2019
- January 2019
- December 2018
- November 2018
- October 2018
- September 2018
- August 2018
- July 2018
- June 2018
- May 2018
- April 2018
- March 2018
- February 2018
- January 2018
- December 2017
- November 2017
- October 2017
- September 2017
- August 2017
- July 2017
- June 2017
- May 2017
- April 2017
- March 2017
- February 2017
- January 2017
- October 2016
- September 2016
- August 2016
- July 2016
- June 2016
- May 2016
- April 2016
- March 2016
- January 2016